The crypto market cap has fallen below $1 trillion following the recent FTX debacle. In this decline, Polygon (MATIC), Cosmos (ATOM), Polkadot (DOT), and Synthetix (SNX) prices have all fallen significantly over the past 24 hours. However, analysts expect further declines for these altcoin projects.
First altcoin polygon (MATIC)
cryptocoin.comAs you can see, in the last 24 hours, the price of MATIC is down 6.65% to $0.9585. Compared to the two crypto market leaders, BTC and ETH, the altcoin weakened by 8.20% and 10.06%, respectively.

The altcoin price is currently trading below the daily EMA line of 20. MATIC price has been very volatile as it fell to $0.8152 before surging above $1. However, it fell back to its current level. However, the relative positions of the EMA lines 9 and 20 on the daily chart for MATIC are showing some upward movement. That means mixed feelings. However, the daily RSI line is below the RSI SMA lines. Hence, the altcoin is trending towards the oversold zone.
The second project with a collapse signal is Cosmos (ATOM)
ATOM is trading at $10.99 at press time, after falling 8.54% over the past day. It also weakened 5.44% and 7.16% against BTC and ETH, respectively.

ATOM is trading below the daily EMA lines of 9 and 20. Also, last week was both down. This downtrend on the EMA line was accompanied by a bearish RSI cross with the RSI SMA line.
Third-tier altcoin Polkadot (DOT)
The altcoin has seen its price drop 2.09% over the past 24 hours. After that, DOT is trading at $5.71 at the time of writing. However, the altcoin managed to gain 1.26% against BTC during this period. However, it weakened by 0.87% against ETH.
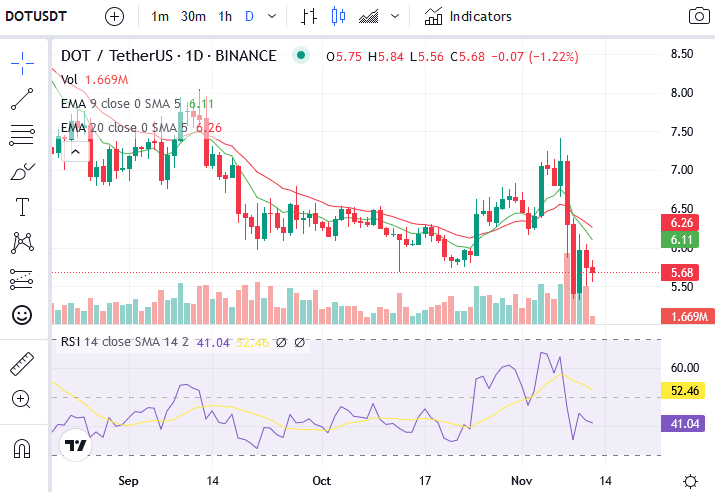
Similar to ATOM, DOT price is trading below the daily EMA lines 9 and 20 after two lines crossed bearish last week. Once again, the bearish divergence of the daily 9 and 20 EMA lines was accompanied by the crossover of the bearish RSI and RSI SMA.
Synthesis (SNX), the last altcoin to signal bearishness
SNX is down 9.66% and is currently trading at $1.74. It also weakened 6.49% and 8.41% against BTC and ETH, respectively.
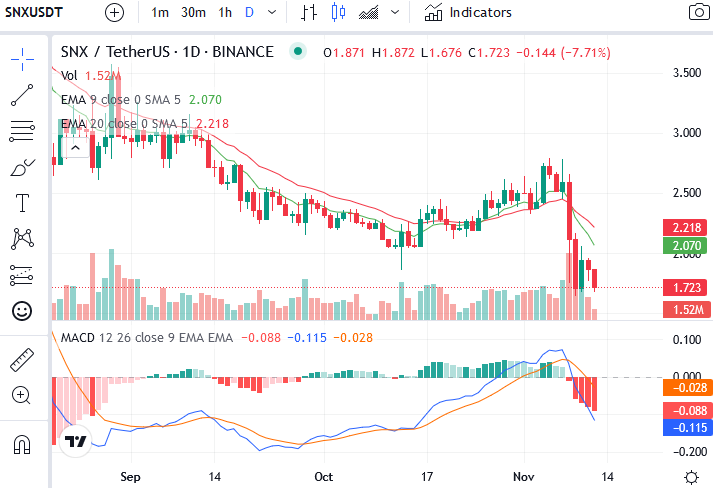
The daily altcoin price chart tells a similar story to other altcoins in this article. Because the bearish divergence at the 9 and 20 daily EMA lines created a negative impulse to force the altcoin price to trade below the 9 and 20 daily EMA lines. Furthermore, the daily MACD and MACD signal lines signaled bearish after crossing the two lines. The gradient of the daily MACD histogram for SNX also has a negative slope over the last 5 days.
Contact us to be informed immediately about the latest developments. chirp‘in, Facebookin and Instagramfollow and telegram and youtube join our channel!
Risk warning: The articles and articles on Kriptokoin.com do not constitute investment advice. Bitcoin and cryptocurrencies are high-risk assets and you should do your own research and due diligence before investing in these currencies. You can lose some or all of your money by investing in bitcoin and cryptocurrencies. Remember that your transfers and transactions are at your own risk and any losses that may occur are your responsibility. Cryptokoin.com does not recommend the purchase or sale of cryptocurrencies or digital assets, nor is Kriptokoin.com an investment advisor. Because of this, Kriptokoin.com and the authors of the articles on the site cannot be held responsible for your investment decisions. Readers should do their own research before taking any action regarding the company, assets, or services contained in this article.
Disclaimer: Advertising on Kriptokoin.com is carried out through third-party advertising channels. In addition, Kriptokoin.com also includes sponsored articles and press releases on its website. For this reason, on the site, advertising links directed by Kriptokoin.com are completely independent of the consent of Kriptokoin.com, and visits and pop-ups guided by advertising links are the responsibility of the user. The advertising on Kriptokoin.com and the pages referred to by the links in the sponsored articles do not bind Kriptokoin.com in any way.
Warning: Citation of Kriptokoin.com news content and citation by providing a link is subject to Kriptokoin.com’s permission. No content of the website may be copied, reproduced or published on any platform without permission. Legal action will be taken against those who use the code, design, text, graphics and any other content of Kriptokoin.com in violation of intellectual property law and relevant laws.
#Watch #Altcoin #Price #Charts #Signs #Crash
No comments:
Post a Comment